Opened on 03/03/2018 at 08:11:45 AM
Closed on 03/13/2018 at 07:13:04 PM
Last modified on 04/05/2018 at 10:01:23 AM
#6440 closed defect (fixed)
High CPU/memory usage when adding large number of custom filters
| Reported by: | mapx | Assignee: | agiammarchi, greiner |
|---|---|---|---|
| Priority: | P1 | Milestone: | |
| Module: | User-Interface | Keywords: | |
| Cc: | greiner, kzar, mjethani, saroyanm, agiammarchi, wspee | Blocked By: | |
| Blocking: | #6450 | Platform: | Unknown / Cross platform |
| Ready: | yes | Confidential: | no |
| Tester: | Ross | Verified working: | yes |
| Review URL(s): |
https://codereview.adblockplus.org/29714596/ |
||
Description (last modified by greiner)
Environment
W10, chrome / firefox (last beta), ABP 3.0.2.1977
Ubuntu 16.04
Chrome 64
Adblock Plus 3.0.2
How to reproduce
- Open options page and go to the Advancted tab
- Copy / paste there the content of easyprivacy list (14000 records)
https://easylist.to/easylist/easyprivacy.txt
- Click on "Save"
Observed behaviour
- the browser becomes unresponsive, high CPU (needing to kill the browser process)
- firefox it's even worse (probably due to the storage.js storage approach)
Expected behaviour
- adding 1, 10 or 10000 filters should have the same smoothly behaviour
What to change
In messageResponder.js
- Switch to using long-lived connections for accepting "*.listen" messages
- Only pass first argument to sendMessage() in addFilterListeners()
Notes
possible fix: use code mirror javascript editor (I tested it in uBo, working fine)
http://codemirror.net/
https://github.com/codemirror/CodeMirror
The same bug was fixed (or at least we had a better behaviour) in the past:
https://issues.adblockplus.org/ticket/4752
Hints for testers
- Adding/modifying/removing filters/preferences/subscriptions should be reflected in the UI by items being added/updated/removed accordingly.
- Triggering "addSubscription" event (using abp-subscribe links) should trigger dialog to show up in options pages.
- Clicking on a social media icon on the first-run page, should trigger the share dialog except after filters that would interfere with it get enabled.
Attachments (1)
Change History (24)
comment:3 Changed on 03/05/2018 at 01:54:22 PM by greiner
comment:4 Changed on 03/05/2018 at 02:22:31 PM by greiner
- Cc saroyanm agiammarchi wspee added
- Component changed from Platform to User-Interface
Actually, I'm seeing a lot of individual messages that are being sent back to the UI, presumably one per filter because onFilterMessage() is triggered for each, which explains this significant slowdown.
One possible reason why the issue persists even after the options page has been closed, could be that the background page is too busy with processing the filters to notice that the page is no longer there.
All in all it looks like a UI issue after all.
comment:5 Changed on 03/05/2018 at 02:26:30 PM by greiner
- Description modified (diff)
- Summary changed from my filter list - extremely slow / high cpu / unresponsive when dealing with large numbers of custom filters to High CPU/memory usage when adding large number of custom filters
comment:6 follow-up: ↓ 7 Changed on 03/05/2018 at 03:27:22 PM by mapx
on normal systems (no ssd) I get unresponsive options page / slow processing even without clicking SAVE (or for example trying to scroll up / down the added filters). A minute or more only to paste the filters and much more for scrolling.
the same test on uBo (last dev builds - which where converted to use code mirror package) gets no slowing processing, no high cpu.
ABP / uBo are doing similar processing on custom filters (some syntax checking).
comment:7 in reply to: ↑ 6 Changed on 03/05/2018 at 03:38:13 PM by agiammarchi
Replying to mapx:
on normal systems (no ssd) I get unresponsive options page / slow processing even without clicking SAVE (or for example trying to scroll up / down the added filters). A minute or more only to paste the filters and much more for scrolling.
the same test on uBo (last dev builds - which where converted to use code mirror package) gets no slowing processing, no high cpu.
ABP / uBo are doing similar processing on custom filters (some syntax checking).
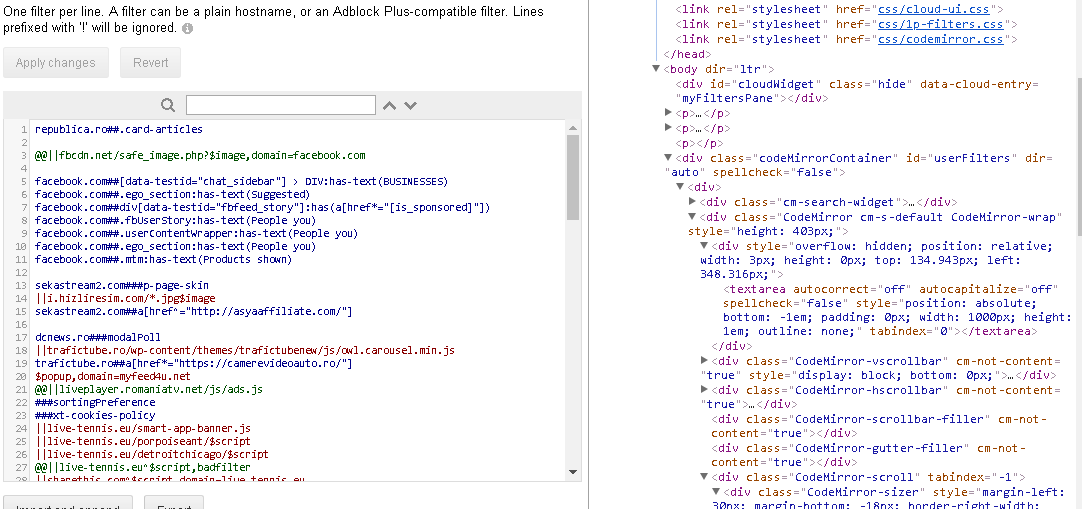
can you please double check if if uBo has any of the following attributes in the textarea element (or if it has a textarea at all) ?
<textarea
  autocomplete="off"
  autocorrect="off"
  autocapitalize="off"
  spellcheck="false"
></textarea>
I start believing our current textarea might try to do things not so perf friendly when there's a lot of data.
Thanks
Changed on 03/05/2018 at 03:50:33 PM by mapx
comment:8 follow-up: ↓ 9 Changed on 03/05/2018 at 03:52:32 PM by mapx
as you can see there is a textarea, but again: all is managed by code mirror js package integrated in uBo.
However, check yourself the last uBo dev build:
https://chrome.google.com/webstore/detail/ublock-origin-dev-build/cgbcahbpdhpcegmbfconppldiemgcoii
comment:9 in reply to: ↑ 8 Changed on 03/05/2018 at 04:19:52 PM by agiammarchi
Replying to mapx:
as you can see there is a textarea, but again: all is managed by code mirror js package integrated in uBo.
Thank you. I'm not sure we'll solve all the issues (seems there are few places we can improve) but your screenshot confirms already that's the minimum we can do to simplify native textarea parsing.
comment:10 Changed on 03/05/2018 at 06:10:11 PM by greiner
I've measured the performance when adding/removing 1,000 filters once with and once without sending a message (i.e. calling sendMessage() in message responder) to the UI to notify it of the changes. After doing two runs, I got the following results:
| with notifying UI | without notifying UI | |
| Adding 1,000 filters | 482ms, 443ms | 33ms, 20ms |
| Removing 1,000 filters | 444ms, 425ms | 23ms, 24ms |
While there may be other parts of the code that could be improved to handle such batch operations, this appears to be the main culprit responsible for the slowdown.
comment:11 Changed on 03/05/2018 at 07:35:58 PM by greiner
Queuing up messages seems to help a bit (~100ms) but going beyond 1,000 filters still causes significant lag, possibly due to memory allocation, GC pauses, etc.
Ideally we'd want to switch to using browser.runtime.connect() to more efficiently pass lots of small messages between the extension and the UI by reducing the overhead that's associated with each single message sent via browser.runtime.sendMessage().
comment:12 Changed on 03/06/2018 at 12:46:36 PM by abpbot
A commit referencing this issue has landed:
Issue 6440 - Disable common textarea features to improve performance
comment:13 Changed on 03/06/2018 at 12:48:33 PM by agiammarchi
one little/easy bit to slightly improve has landed so @greiner if you need any help with the rest please let me know, thanks.
comment:14 Changed on 03/06/2018 at 01:59:06 PM by greiner
I adapted the code to use browser.runtime.connect() to see what difference that makes and found that message passing-related processing still takes up ~75% in total (two thirds of which are spent on serializing the data we're passing).
Next up I'll be looking into what data we send to find ways to reduce the amount we're passing to the UI.
comment:15 Changed on 03/06/2018 at 05:28:44 PM by saroyanm
This seems to be true for also old options page.
@mapx can you please also confirm that you having same issue with the old options page as well(From the stable build), this will help us identifying if we are introducing a regression by releasing new options page.
comment:16 Changed on 03/06/2018 at 05:37:33 PM by mapx
The first part (paste 14000 filters, scrolling, without save) is much better (very fast).
The second (save ...waiting ...waiting ...unresponsive messages ...) is the same as in the new options page.
comment:17 Changed on 03/06/2018 at 06:11:13 PM by greiner
- Blocking 6450 added
- Description modified (diff)
- Owner set to greiner
- Priority changed from Unknown to P1
- Ready set
I've updated the ticket description based on my findings. Namely, we've been sending a huge amount of unused data to the options page which we can easily cut down on as well as we can switch to a more efficient way of sending lots of messages.
Even after those changes it'll still take a long time (on my computer about 15s for adding/removing all filters in EasyPrivacy) when editing large amounts of filters but at least it's a start so that we can work on further optimizations. Therefore I've created #6450 to keep track of any performance improvements related to dealing with lots of filters in the UI.
comment:18 Changed on 03/06/2018 at 06:14:50 PM by greiner
- Owner changed from greiner to agiammarchi, greiner
comment:19 Changed on 03/06/2018 at 07:00:35 PM by greiner
- Review URL(s) modified (diff)
- Status changed from new to reviewing
comment:20 Changed on 03/13/2018 at 07:03:44 PM by abpbot
A commit referencing this issue has landed:
Issue 6440 - Use long-lived connections to listen to extension events
comment:21 Changed on 03/13/2018 at 07:09:55 PM by greiner
- Description modified (diff)
Added hints for testers.
comment:22 Changed on 03/13/2018 at 07:13:04 PM by greiner
- Resolution set to fixed
- Status changed from reviewing to closed
The general changes outlined in the description have now landed in the UI repository so I'm closing this ticket. As mentioned before, further optimizations will be tracked at #6450.
comment:23 Changed on 04/05/2018 at 10:01:23 AM by Ross
- Tester changed from Unknown to Ross
- Verified working set
Fixed. There is still quite the delay but it is improved with further improvements planned in #6450.
ABP 3.0.2.2002
Firefox 51 / 58 / Windows 10
Chrome 49 / 65 / Windows 7
Opera 36 / 51 / Windows 7
I was able to confirm this issue on:
Note that this issue only appears after clicking on the "Save" button and the CPU and memory usage remains high even after closing the options page. So unless it's caused by the code in the message responder, I'd rule out any UI-related code at this point.